U.S. Dollar and President Trump
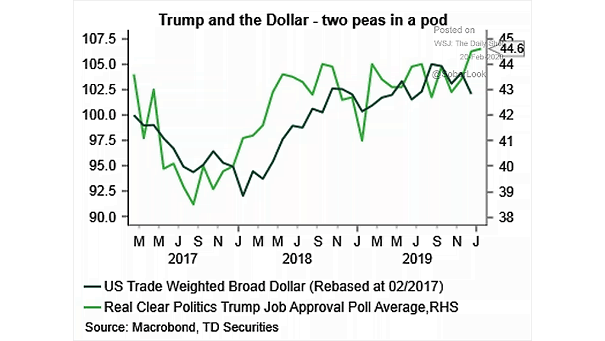
U.S. Dollar and President Trump This chart shows the correlation between the U.S. dollar and President Trump’s approval ratings Image: TD securities
U.S. Dollar and President Trump This chart shows the correlation between the U.S. dollar and President Trump’s approval ratings Image: TD securities
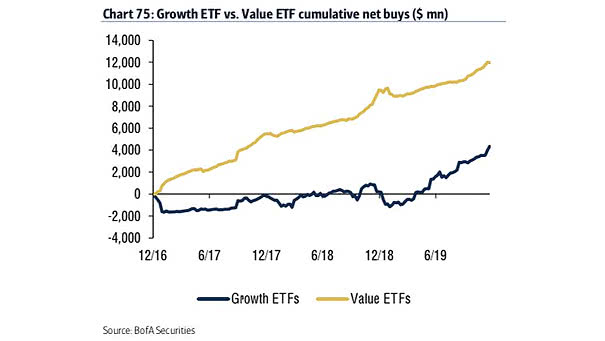
Cumulative Flows into Growth ETF vs. Value ETF Performance has been in favor of growth this year, despite flow into value. Image: BofA Securities

U.S. Economic Expansion The current economic cycle is the longest on record, but the weakest of the post-WWII era. Image: Wells Fargo Securities International Limited
Cumulative Flows into Small and Mid Cap Equity ETFs Chart showing robust inflows into small and mid-cap ETFs this year. Image: BofA Securities
U.S. Real GDP Forecast for 2019 and 2020 Wells Fargo does not yet see a recession in the U.S. and forecasts U.S. real GDP growth of 2.2% in 2019 and 1.7% in 2020 (as of October 2019). Image: Wells Fargo Securities, LLC
Federal Reserve’s Balance Sheet This chart shows the Federal Reserve total assets. According to the NY Fed, the Fed’s balance sheet could be between $3.8 trillion and $4.7 trillion by 2025. Image: Wells Fargo Securities, LLC
Total U.S. Treasury Holdings by Foreigners Japan and China are the two major foreign holders of U.S. Treasury securities. And currently, Japan surpasses China. Image: Bianco Research
New York Fed Probability of Recession in Next 12 Months since 1990 When an inverted yield curve occurs, short-term interest rates exceed long-term rates. It suggests that the long-term economic outlookis poor and that the yields offered by long-term fixed income securities will continue to decline. Since 1962, no recession has occurred without an inverted…
Yield Curve Inversion, How Long Until The Recession? In recent history, once the 10-Year minus 3-Month Treasury yield spread is negative and hits 10 consecutive days, it persists for weeks/months. When an inverted yield curve occurs, short-term interest rates exceed long-term rates. It suggests that the long-term economic outlook is poor and that the yields offered…
What Indicators to Watch for Signs a U.S. Recession Is Coming? 1) In recent history, a recession occurs about 12 to 18 months after the spread between the 30-year and the 3-month treasury yields turns negative (red arrow). When an inverted yield curve occurs, short-term interest rates exceed long-term rates. It suggests that the long-term…
For the Last Few Years, Equity Markets Have Been Leading Bond Markets When both markets do not react simultaneously, then one market leads the other and the securities are mispriced temporarily. Image: Hayek and Keynes