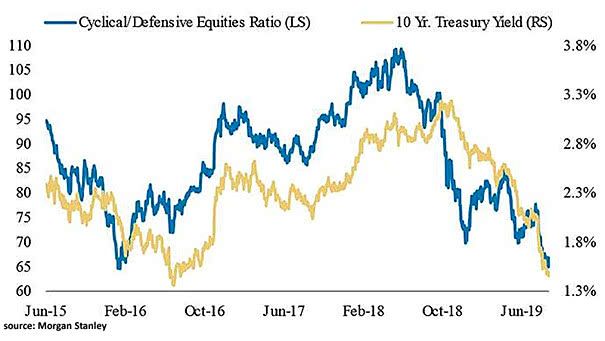
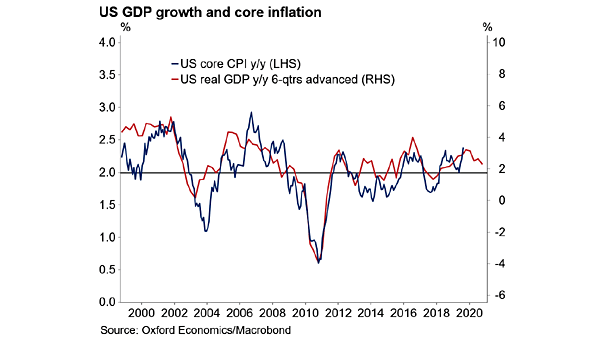
Lower Returns for Stocks in the Next 12 Months?

Lower Returns for Stocks in the Next 12 Months? Morgan Stanley’s cyclical indicator is flagging “downturn.” The yield curve’s slope, debt issuance, consumer confidence, economic and financial markets data are aggregated in Morgan Stanley’s cyclical indicator. The entry into the “downturn” phase suggests lower returns for stocks and risky assets in the next 12 months. Image:…

Decomposing the U.S. 10-Year minus 3-Month Treasury Yield Spread since 2013

Decomposing the U.S. 10-Year minus 3-Month Treasury Yield Spread since 2013 This great chart shows that the “Global Economic Data” variable has a significant impact on the U.S. 10-year minus 3-month Treasury yield spread since 2018. An R² of 0.902 means that more than 90 percent of the variance in the U.S. 10-year minus 3-month Treasury yield spread…

US Yield Curve Inversions since 1966

US Yield Curve Inversions since 1966 Currently, investors are concerned about yield curve inversions, because they have been a indicator of a coming recession. But not all inversions are the same. If the yield curve inversion is due to 10-year falling, then it is a “risk-off” trade, and not an economic cycle turn. This great chart…

Leading Indicators Show Growth Is Slowing, But Is Still Positive

Leading Indicators Show Growth Is Slowing, But Is Still Positive Since 1970, the Leading Economic Index has turned negative year-over-year, on average 14 months before all recessions. U.S. growth is slowing, but the current LEI rose 2.7% year-over-year and suggests there is no imminent recession on the horizon. Image: LPL Research

Should Investors Be Concerned About Rising Oil Prices?

Should Investors Be Concerned About Rising Oil Prices? Because the U.S. becomes entirely self-sufficient, it helps to contain oil prices in the long-term. Cheap oil is good for global economic growth, business and consumers. Image: J.P. Morgan Asset Management

What Indicators to Watch for Signs a U.S. Recession Is Coming?

What Indicators to Watch for Signs a U.S. Recession Is Coming? 1) In recent history, a recession occurs about 12 to 18 months after the spread between the 30-year and the 3-month treasury yields turns negative (red arrow). When an inverted yield curve occurs, short-term interest rates exceed long-term rates. It suggests that the long-term…

VIX & Yield Curve Cycle Since 2007

VIX & Yield Curve Cycle Since 2007 This chart also shows that we are in a late business cycle. The spread between the 30-year and the 3-month treasury yields is one of the most interesting spreads to watch. In recent history, a recession occurs about 12 to 18 months after the yield curve inverts. Image:…

Treasury Options and Yield Curve Cycle Since 2007

Treasury Options and Yield Curve Cycle Since 2007 This great chart shows that we are in a late business cycle. The spread between the 30-year and the 3-month treasury yields is one of the most interesting spreads to watch. In recent history, a recession occurs about 12 to 18 months after the yield curve inverts.…

Do Central Banks’ Negative Rates Work in Europe?

Do Central Banks’ Negative Rates Work in Europe? Not really. Actually, negative rates distort economies and leave little room to maneuver in the next recession. Secondly, extremely low interest rates are also bad for European banks, like Deutsche Bank, which in turn is bad for economic growth. It’s a feedback loop which could lead to…