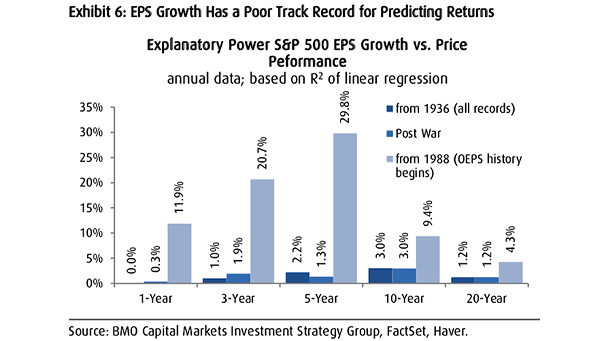
S&P 500 EPS Growth vs. Price Performance
S&P 500 EPS Growth vs. Price Performance Chart showing the poor relationship between earnings growth and market performance, even in the long term. Image: BMO Capital Markets Investment Strategy Group
S&P 500 EPS Growth vs. Price Performance Chart showing the poor relationship between earnings growth and market performance, even in the long term. Image: BMO Capital Markets Investment Strategy Group
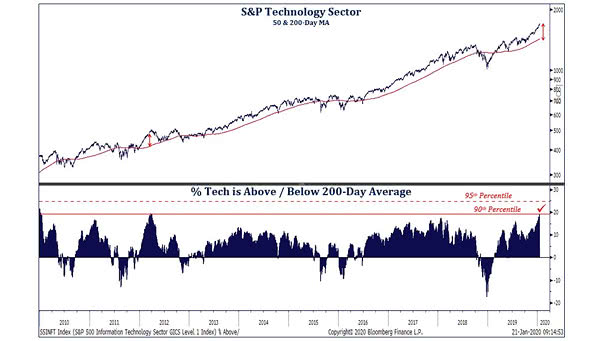
S&P Technology Sector and 200-Day Moving Average The chart suggests that the tech sector appears stretched, at nearly 20% above its 200-day moving average. Image: Strategas
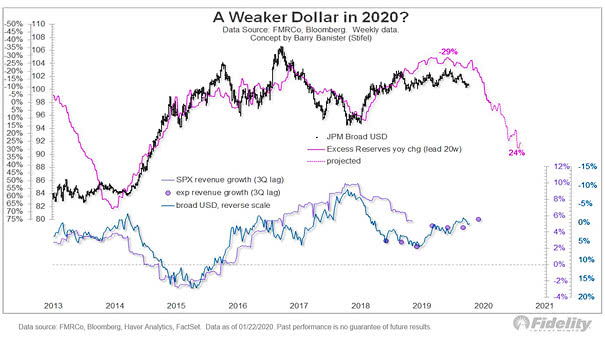
A Weaker U.S. Dollar in 2020? This chart suggests that the U.S. dollar could decline this year, as long as the Fed keeps pumping money into the banking system. Image: Fidelity Investments
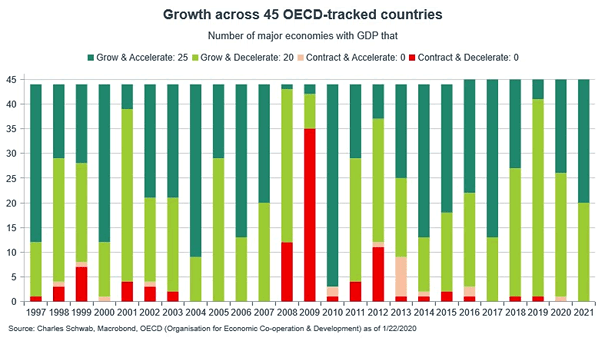
Growth Across 45 OECD Tracked Countries Chart suggesting stable growth this year and accelerating growth next year. Image: Charles Schwab
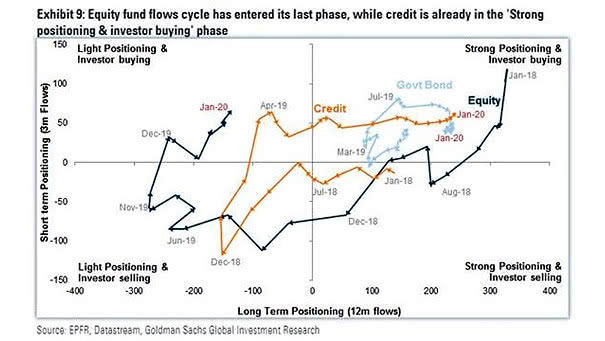
Equity Fund Flows Cycle, Credit and Government Bond Chart suggesting that the equity fund flows cycle has entered its last phase. Image: Goldman Sachs Global Investment Research
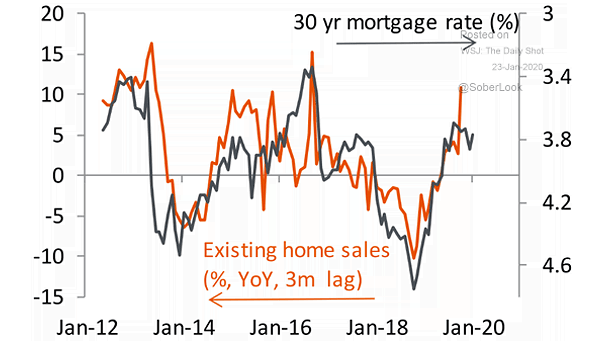
Housing – U.S. Existing Home Sales and 30-Year Mortgage Rate This chart shows the correlation between U.S. existing home sales and the 30-year mortgage rate (inverted), and suggests further improvements in sales. Image : Piper…
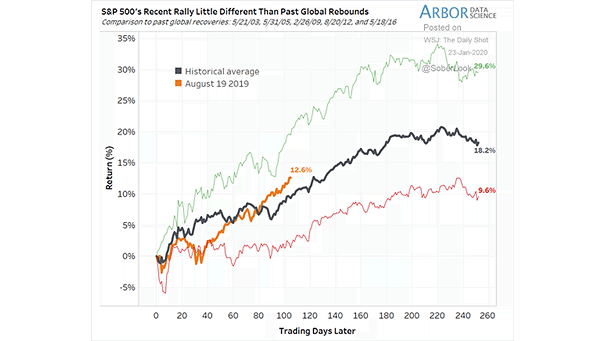
S&P 500 and Past Global Recoveries This chart compares the S&P 500’s recent rally with past global recoveries. Image: Arbor Research & Trading LLC
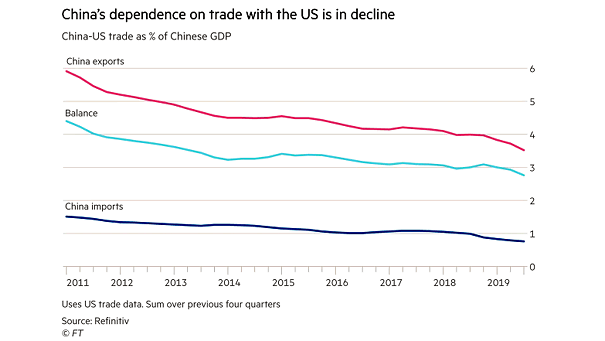
China-US Trade as % of Chinese GDP The downtrend in China-US trade will be hard to reverse, even with the “phase one” trade deal. Image: Financial Times
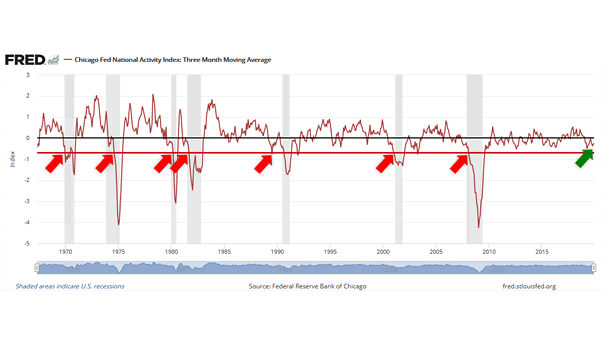
Chicago Fed National Activity Index and Recessions The Chicago Fed National Activity Index fall to -0.35 in December, and stayed at a negative reading. Anything negative is below-average growth. In recent history, anything at or below -0.7…
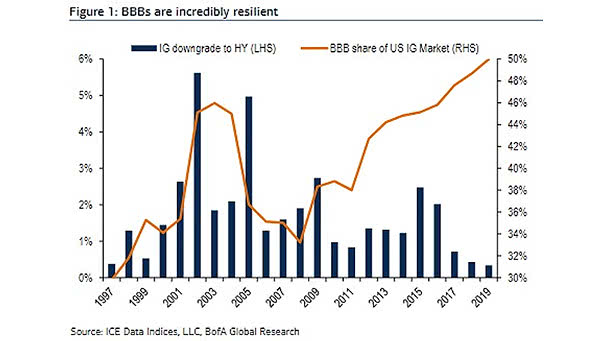
Corporate Bonds: IG Downgrade to HY and BBB Share of U.S. IG Market This chart highlights the resilience of BBB-rated bonds. BofA believes that there is little risk that IG ratings will fall to junk status…
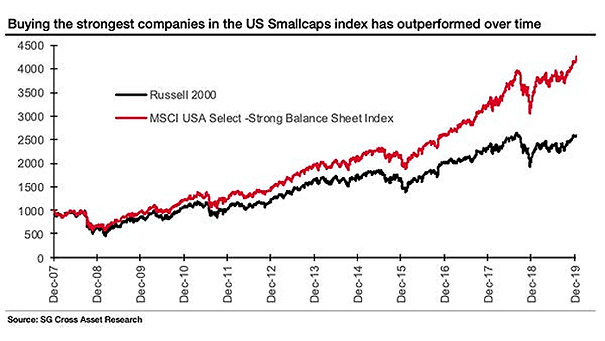
Small Caps: Russell 2000 vs. MSCI USA Select Strong Balance Sheet Index Chart suggesting that it makes sense to avoid balance sheet risk in U.S. small caps. Image: Societe Generale Cross Asset Research