Bond Volatility – MOVE Index
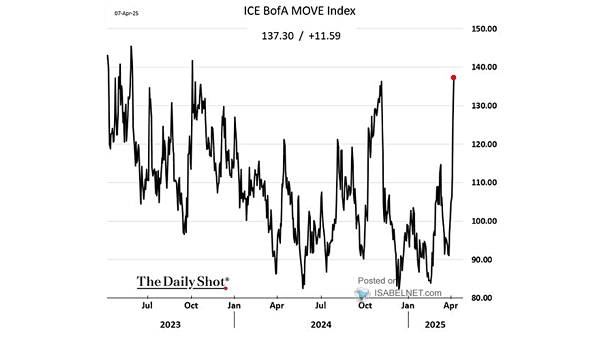
Bond Volatility – MOVE Index U.S. rate volatility keeps climbing as Middle East tensions shake investors, pushing the MOVE index above 95 and pulling stocks lower. The spike tells you everything about the market mood…
Bond Volatility – MOVE Index U.S. rate volatility keeps climbing as Middle East tensions shake investors, pushing the MOVE index above 95 and pulling stocks lower. The spike tells you everything about the market mood…
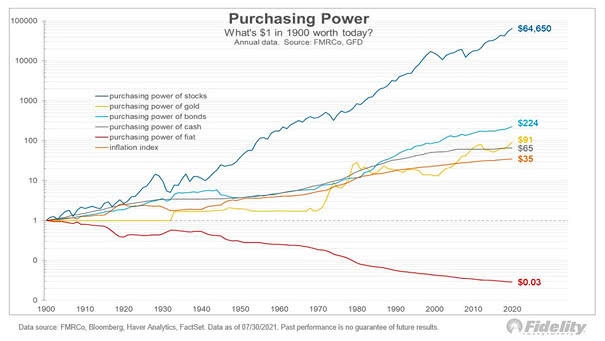
Purchasing Power of the U.S. Dollar (Measured by Inflation): Invested vs. Uninvested Gold hasn’t lost its glow, but U.S. stocks have shone brighter since 1928. Look far enough ahead, and the edge moves to assets…
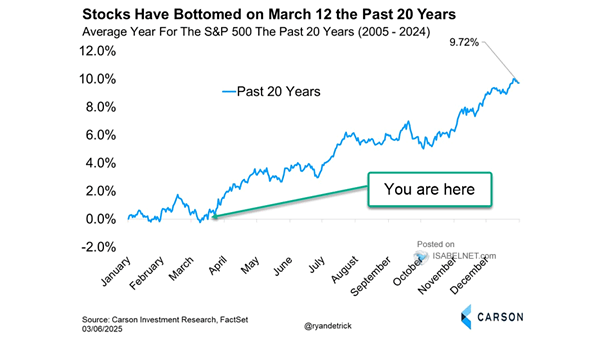
Average Year for the S&P 500 the Past 20 Years Over the past two decades, March 12 has often marked the bottom for U.S. stocks, with rebounds taking shape soon after. History doesn’t always repeat itself,…
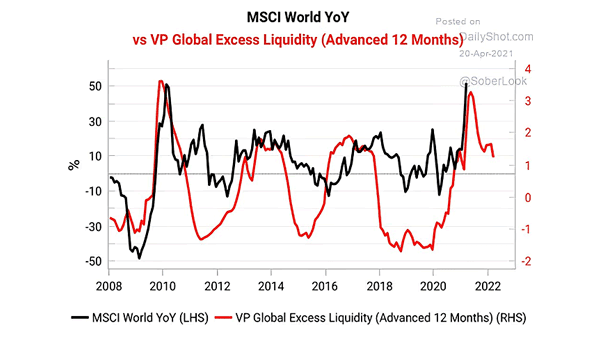
S&P 500 – MSCI U.S. vs. G10 Excess Liquidity (Leading Indicator) G10 excess liquidity, the gap between real money growth and economic growth, is climbing again as it returns to post‑pandemic highs and gives U.S.…
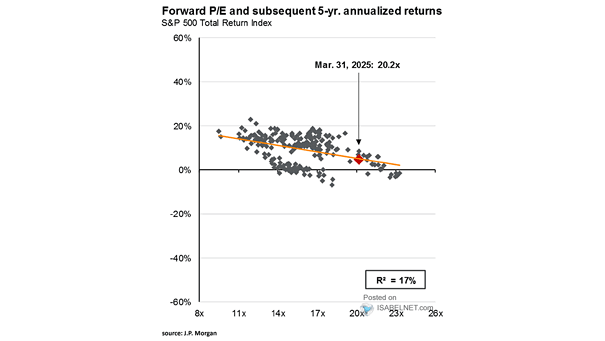
Forward P/E Ratio and Subsequent 5-Year Annualized Returns Elevated U.S. stock valuations point to a tougher road for returns over the coming five years. That’s the classic problem: great companies, but not always great prices.…
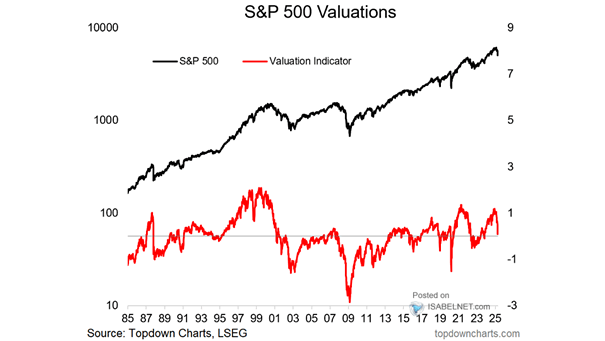
S&P 500 Sentiment and Valuations Cracks are emerging as S&P 500 sentiment and valuation indicators are slipping from stretched territory, a move investors should keep an eye on. Markets rarely stay overheated for long. Image:…
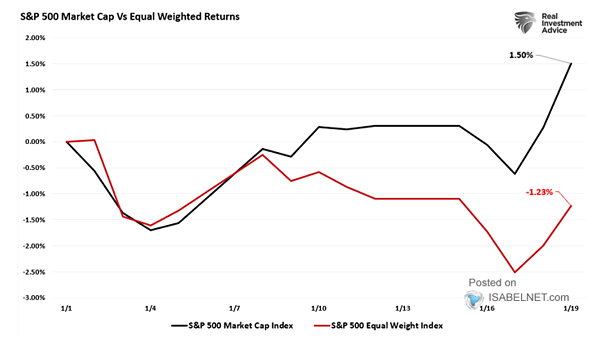
S&P 500 Equal Weight Index vs. S&P 500 Index – Two-Year Performance Spread Investors’ rush from tech to value has driven one of the deepest performance gaps between the market-cap and equal-weighted indexes since the…
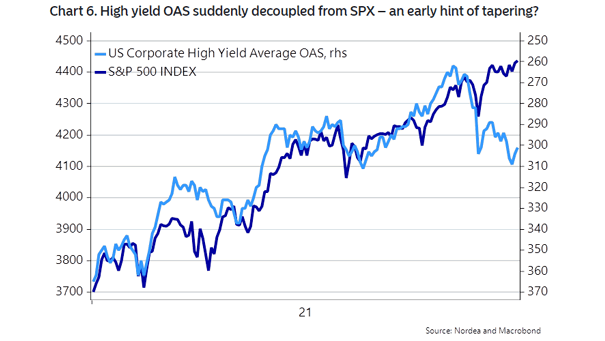
S&P 500 vs. U.S. Corp Investment Grade All Sectors OAS A widening OAS for investment grade debt is typically a bearish signal for U.S. equities. That’s not what stock bulls want to see. Image: TS…
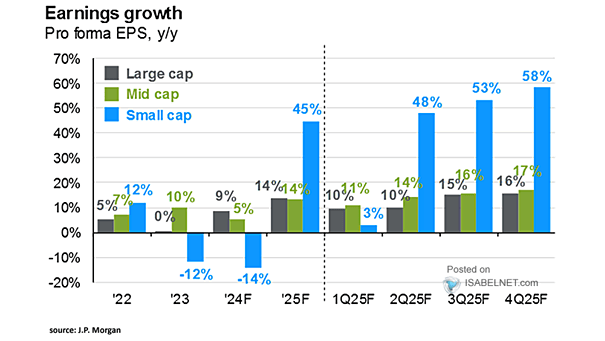
Earnings Growth – Mag 7 and S&P 500 ex-Mag 7 With earnings set to jump 26% this year, the Magnificent Seven look poised to outpace the rest of the S&P 500, where growth is seen…
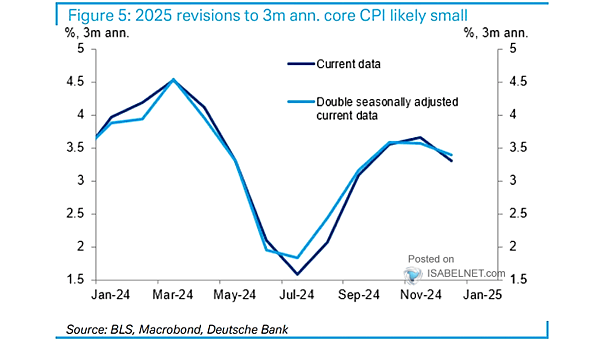
U.S. Core CPI Inflation U.S. inflation cooled in February as core CPI rose 0.22%, right on expectations. The annual rate slowed to 2.5%, marking steady disinflation progress but still short of the Fed’s 2% target.…
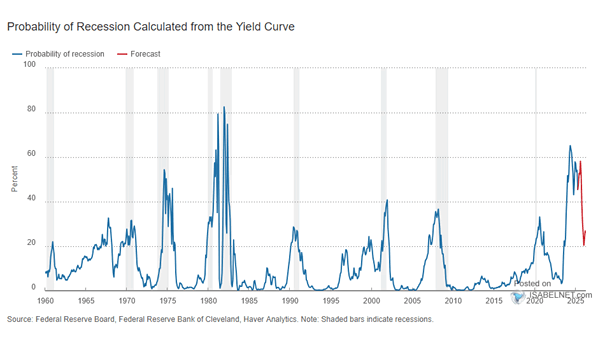
Probability of U.S. Recession Calculated from the Yield Curve The probability of U.S. recession in 12 months, calculated from the yield curve, stands at 17.8%, keeping the outlook skewed toward ongoing expansion. The cycle isn’t…