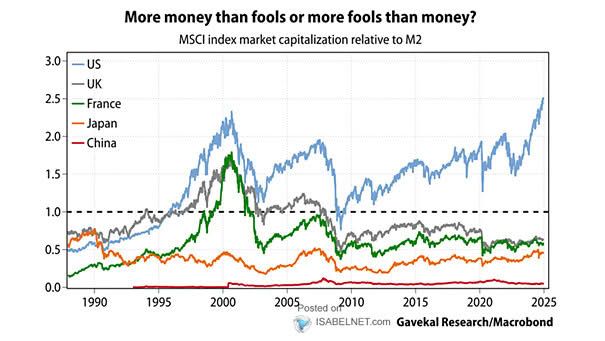
S&P 500 vs. Trend Line Growth

S&P 500 vs. Trend Line Growth Long-term trend charts show the S&P 500 trading significantly above its historical growth trajectory, with valuations at elevated levels—implying that U.S. equities are overvalued by traditional measures. Image: Ned Davis Research

Earnings of Tech Companies

Earnings of Tech Companies While U.S. tech stocks benefit from a wave of strong performance fueled by both hype and solid earnings fundamentals, non-tech stocks continue to experience prolonged earnings stagnation. Image: Topdown Charts

S&P 500 – Length and Severity of Bear and Subsequent Bull Markets

S&P 500 – Length and Severity of Bear and Subsequent Bull Markets Since 1970, the typical bear market lasts roughly 14 months, experiencing an average decline of around 38%, and is followed by bull markets that last about 70 months and generate average returns of 221%. Image: J.P. Morgan Asset Management

Energy Group Positioning

Energy Group Positioning Energy positioning in the 55th percentile is considered neutral and far from extreme. Image: Deutsche Bank Asset Allocation

S&P 500 3-Month Return Dispersion

S&P 500 3-Month Return Dispersion S&P 500 return dispersion has risen above the long-term average in recent months, indicating that the gap between the best- and worst-performing stocks in the index has widened significantly. Image: Goldman Sachs Global Investment Research

S&P 500 Index

S&P 500 Index Inflation rose more slowly than expected, pushing the U.S. stock market to record highs. Given the current inflation outlook and Fed policy expectations, U.S. stocks may continue to climb. Image: Bloomberg

ISM Composite Index vs. Recessions

ISM Composite Index vs. Recessions The economically weighted ISM composite index for the U.S. shows that economic activity is not booming, but does not suggest a looming recession. Image: Real Investment Advice

S&P 500 Returns After Fed Cuts Within 2% of an All-Time High

S&P 500 Returns After Fed Cuts Within 2% of an All-Time High When the S&P 500 is within 2% of an all-time high and the Fed cuts rates, historical data since 1980 shows that the index has risen 100% of the time over the following 12 months, with an average return of 13.9%. Image: Carson…

VIX – Volatility Index

VIX – Volatility Index Market confidence and complacency, spurred by expectations of Fed rate cuts and strong economic data, have pushed the VIX to its lowest level in 2025; yet, volatility may resurface before year-end. Image: The Daily Chartbook

Positions in S&P 500 Equity Futures by Asset Managers

Positions in S&P 500 Equity Futures by Asset Managers Despite record highs in U.S. equities, asset managers’ positions in U.S. equity futures are still below their levels from the start of the year. Image: J.P. Morgan

Healthcare Positioning

Healthcare Positioning The rare risk aversion seen in healthcare stocks—stemming from recent underperformance and ongoing uncertainties—could signal significant value for long-term investors willing to endure short-term volatility. Image: Deutsche Bank Asset Allocation