U.S. Economic Forecasts
U.S. Economic Forecasts Deutsche Bank sees U.S. growth staying strong through 2028, with core inflation easing toward the Fed’s 2% target and job markets holding firm. Image: Deutsche Bank Click the Image to Enlarge
U.S. Economic Forecasts Deutsche Bank sees U.S. growth staying strong through 2028, with core inflation easing toward the Fed’s 2% target and job markets holding firm. Image: Deutsche Bank Click the Image to Enlarge
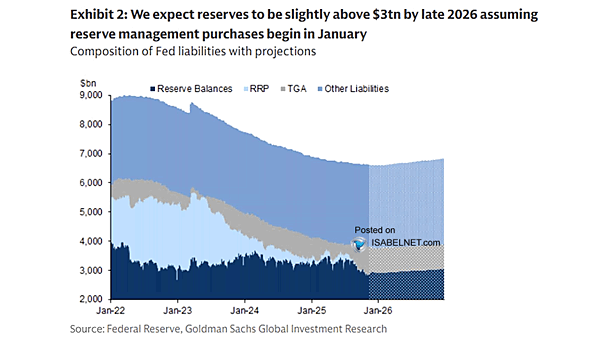
Composition of Fed Liabilities with Projections With QT ending, the Fed will pivot to reserve management purchases of Treasury bills in early 2026. Goldman Sachs expects bank reserves to climb past $3 trillion by late next year, a sign that liquidity is finally loosening again. Image: Goldman Sachs Global Investment Research
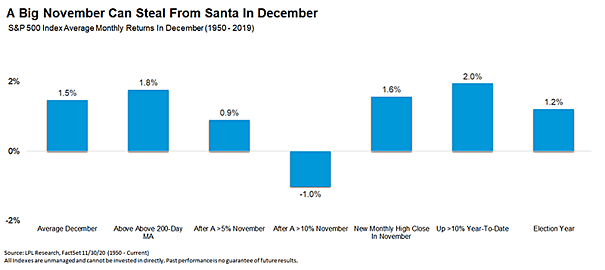
S&P 500 December Returns The S&P 500 lost ground last December, but two red Decembers in a row are rare. That track record may give bulls hope for a Santa Claus rally and a strong finish to the year. Image: Carson Investment Research
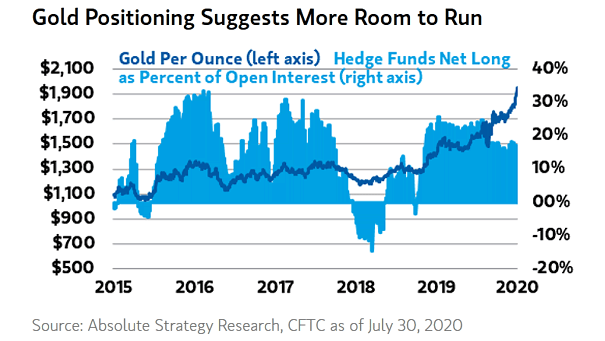
Gold Positioning Rising long positions in gold over the past two weeks point to strengthening demand, a classic bullish sign that keeps the rally in play. Image: Bloomberg
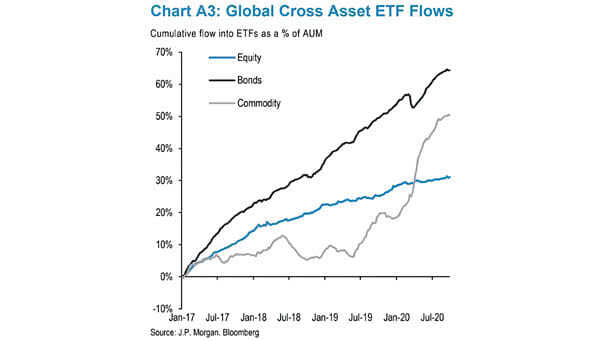
Asset Class Flow The surge of capital into U.S. stock funds in 2025 was largely fueled by optimism around growth prospects, strong earnings, and heavy investments by tech and AI giants. Image: J.P. Morgan Equity Derivatives Strategy
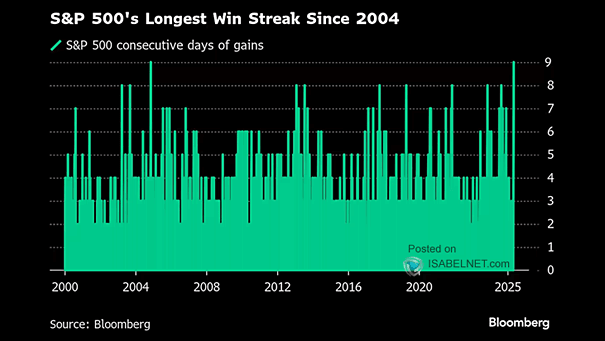
S&P 500 Monthly Gains Tracker Seven months of uninterrupted gains in the S&P 500 mark a rare streak, one that often cools around this stage. Even so, history tends to favor the bulls over the next year, just with a bumpier ride. Image: Topdown Charts
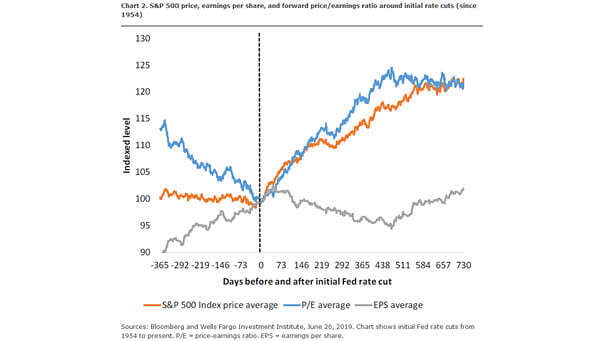
S&P 500 Performance Around First Fed Cut Fed easing sounds bullish, but not when growth cracks. In recessions, U.S. stocks have often fallen despite cheaper money. Image: Goldman Sachs Global Investment Research
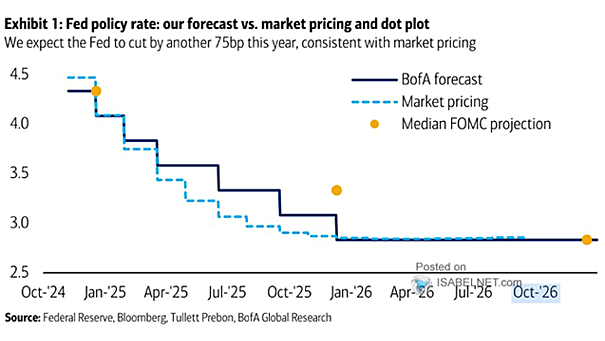
Market Pricing of Fed Rate Cuts Traders are increasingly confident the Fed will cut rates at the December 10, 2025 FOMC meeting, pricing in an 86% chance of a quarter-point move and just a 23% likelihood of another cut in January 2026. Image: Deutsche Bank
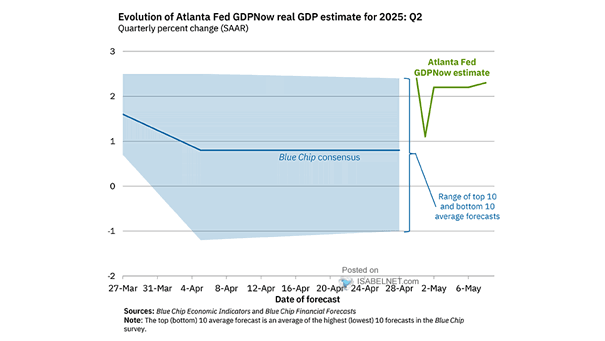
Atlanta Fed GDPNow U.S. Real GDP Estimate Estimates from the Atlanta Fed’s GDPNow point to 3.9% annualized GDP growth in Q3 2025, a reminder that the U.S. economy isn’t cooling just yet. Image: Federal Reserve Bank of Atlanta
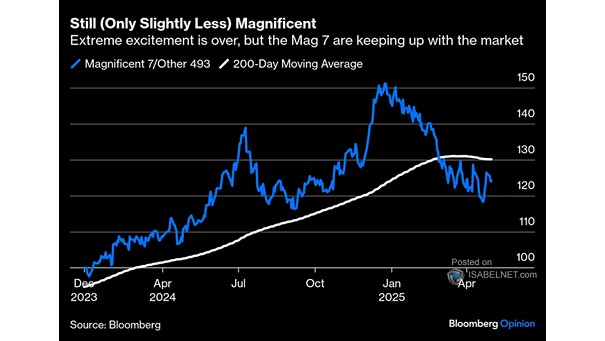
Magnificent Seven Returns With one sector and seven giants driving the world’s biggest stock market, volatility isn’t going anywhere. Investors should brace for more swings in 2026. Image: Deutsche Bank
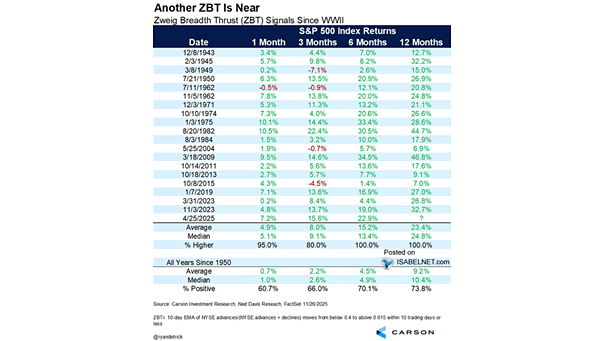
S&P 500 Index Returns – Zweig Breadth Thrust Signals Since WWII The Zweig Breadth Thrust that flashed in late April 2025 drew plenty of doubters. Six months later, the S&P 500 has roared nearly 23% higher. Now, another ZBT may be forming, hinting the bulls still have fuel in the tank. Image: Carson Investment Research