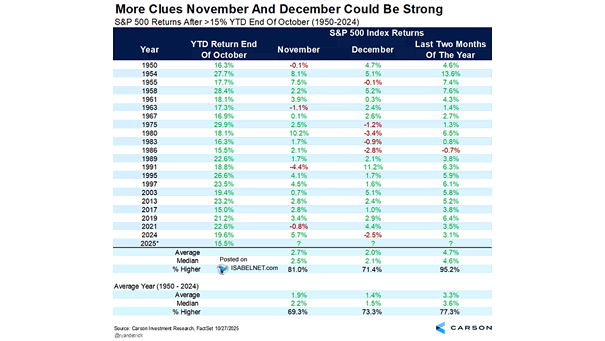
S&P 500 Index Max Pullback per Calendar Year

S&P 500 Index Max Pullback per Calendar Year Corrections can be unsettling for investors but don’t always signal a more severe downturn. Since 1980, the S&P 500 has had 16 corrections that didn’t lead to bear markets, resulting in an average gain of 9.5% for those years. Image: Carson Investment Research

Performance – Gold vs. S&P 500

Performance – Gold vs. S&P 500 Warren Buffett has a skeptical view of gold as an investment, but apparently, gold didn’t get the memo and has been outperforming the S&P 500 this century! Image: Bloomberg

Periods of S&P 500 Correction Above 10%

Periods of S&P 500 Correction Above 10% Due to the U.S. stock market’s dominant position, a correction exceeding 10% frequently triggers a domino effect across global equity markets, as investors react to heightened uncertainty and risk aversion. Image: Goldman Sachs Global Investment Research

How Often Does a Correction Turn into a Bear Market?

How Often Does a Correction Turn into a Bear Market? Historically, a 10% correction rarely leads to a 20% bear market without economic downturns, earnings declines, or rate hikes. With no very serious adverse indicators currently, a bear market seems unlikely in the near term. Image: Carson Investment Research

S&P 500 Pre and Post Fed Rate Cuts

S&P 500 Pre and Post Fed Rate Cuts Historically, U.S. stocks have demonstrated robust performance in the two years following the start of a Fed rate cut cycle, particularly during periods without recession. Image: Goldman Sachs Global Investment Research

ISABELNET Cartoon of the Day

ISABELNET Cartoon of the Day As U.S. stocks tumble, bears are writing eulogies for the market. Bulls, on the other hand, are buying the dip like there’s no tomorrow, which is ironically what bears foresee! Happy Friday, Everyone! 😎

S&P 500 Valuations

S&P 500 Valuations Valuations don’t matter—until they do. Prolonged periods of high valuations can lead to lower future returns, so investors should approach them with caution. Image: Topdown Charts

Average Year for the S&P 500 the Past 20 Years

Average Year for the S&P 500 the Past 20 Years Bulls have reason to smile, as March 12 has marked notable market bottoms for U.S. stocks over the past two decades, and from that point, things tend to improve significantly. “History doesn’t repeat itself, but it often rhymes.” Image: Carson Investment Research

ISABELNET Cartoon of the Day

ISABELNET Cartoon of the Day February’s CPI inflation drops to 2.8%, beating the 2.9% forecast. On CPI days, bulls are like kids in a candy store, while bears sit in the corner, sulking like they forgot their party hats! Happy Great Day, Everyone! 😎

Inflation – U.S. 10-Year Breakeven Rate

Inflation – U.S. 10-Year Breakeven Rate The declining U.S. 10-year breakeven inflation rate indicates that market participants expect inflation to moderate, aligning with the Fed’s 2% long-term target. Image: The Daily Shot