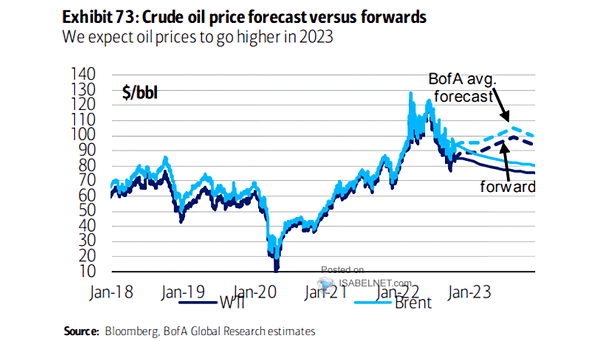
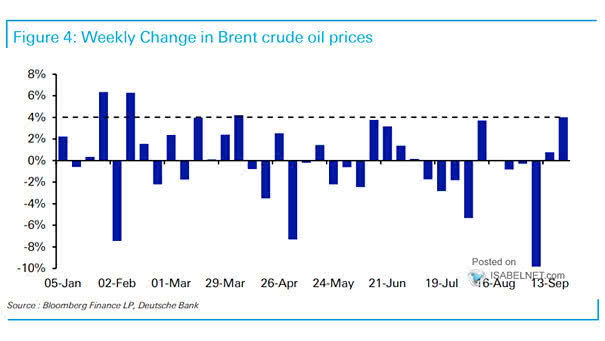
ISABELNET Cartoon of the Day

ISABELNET Cartoon of the Day With the S&P 500 up 2.92% this week, bulls are confident the market’s momentum will continue, while bears argue it’s just a bear market rally! Have a Great Weekend, Everyone! 😎

Trade Policy Uncertainty

Trade Policy Uncertainty When trade policy uncertainty peaks, the S&P 500 often posts positive returns. Markets tend to over-discount risks during uncertain periods, and relief rallies are common once worst-case scenarios are avoided or resolved. Image: Goldman Sachs Global Investment Research

S&P 500 Index Return During May

S&P 500 Index Return During May The “sell in May and go away” adage is more myth than practical advice. Rather than trying to time the market, focusing on long-term goals is wiser-especially since May has delivered positive returns in 9 of the past 10 years. Image: Carson Investment Research

Price of Gold

Price of Gold While gold remains in a long-term bull market, short-term pullbacks are normal following strong advances-especially as factors driving safe-haven demand begin to fade. Image: The Daily Shot

ISABELNET Cartoon of the Day

ISABELNET Cartoon of the Day Despite a strong rally this week, the S&P 500 index ended April down 0.76%. No need to panic-this isn’t a call to “Make Bears Great Again!” unless you prefer market declines. Happy Friday, Everyone! 😎

Probability of U.S. Recession As Priced Across Asset Classes

Probability of U.S. Recession As Priced Across Asset Classes The S&P 500 is pricing in about a 25% chance of a recession, which is lower than signals from copper prices or the yield curve, but higher than the recession probabilities implied by global equities or high-yield credit markets. Analysts often use the current percentage change…

S&P 500 Index vs. 200 and 40-Week Moving Averages

S&P 500 Index vs. 200 and 40-Week Moving Averages Despite recent volatility driven by trade concerns, as long as the S&P 500 index is trading above the 200-week moving average, the secular bull market remains intact. Image: Real Investment Advice

Valuation – S&P 500 12-Month Forward P/E Ratio

Valuation – S&P 500 12-Month Forward P/E Ratio The S&P 500’s forward P/E ratio of 20x places it above historical averages, reinforcing the view that current valuations are not historically cheap. Image: The Daily Shot

ISABELNET Cartoon of the Day

ISABELNET Cartoon of the Day The S&P 500’s 7.8% drop in Trump’s first 100 days has bulls asking if this market comes with a money-back guarantee. Meanwhile, bears are finally coming out of hibernation-and they look hungry! Have a Great Day, Everyone! 😎

U.S. Unemployment Rate

U.S. Unemployment Rate Could the U.S. consumer—remarkably resilient thus far—face potential cracks from escalating trade tensions, immigration policy shifts, and fiscal adjustments? Image: Deutsche Bank

Number of U.S. IPOs

Number of U.S. IPOs Despite ongoing uncertainties, could the U.S. IPO market experience growth and recovery in 2025? Image: Goldman Sachs Global Investment Research