U.S. ISM Manufacturing and Services Survey Data
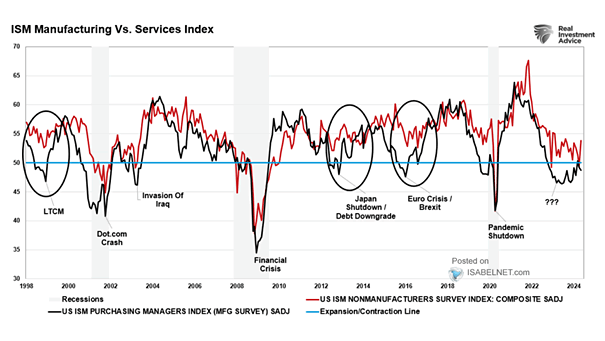
U.S. ISM Manufacturing and Services Survey Data Economists call it a “soft recession” when factories slow but services keep humming. That resilience on the services side is what kept the U.S. out of a recession. But if services begin to crack, things could shift quickly. Image: Real Investment Advice