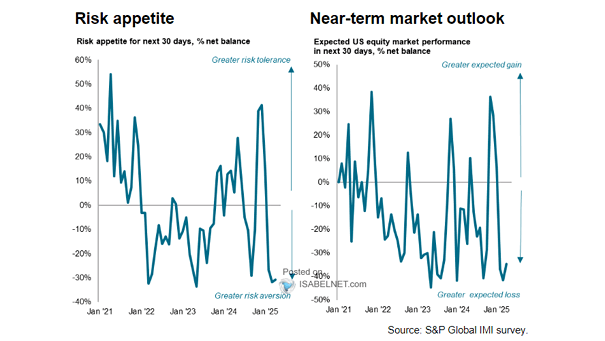
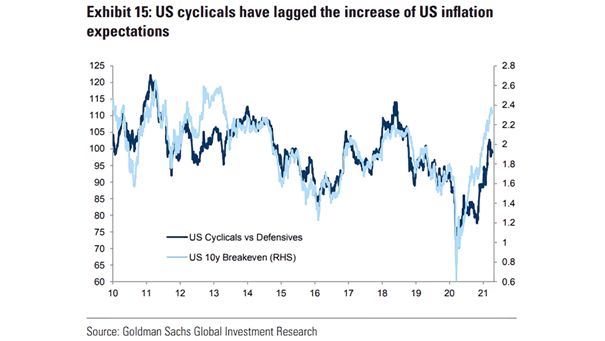
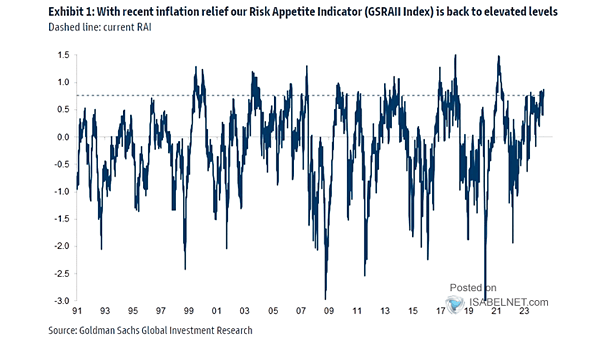
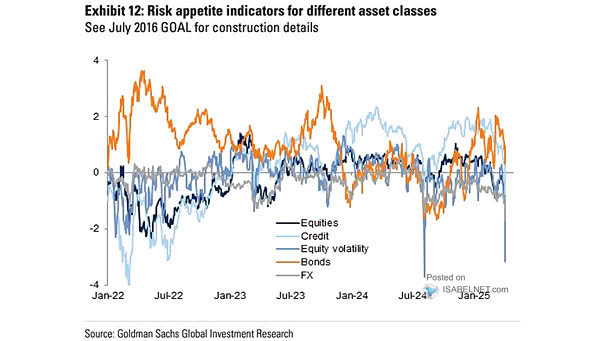
Gold vs. Bitcoin

Gold vs. Bitcoin The gap between gold and bitcoin has widened in recent weeks. Safe‑haven flows have lifted gold, while bitcoin has been trading more like a high‑beta risk asset, closely tracking tech and growth…

S&P 500 Index

S&P 500 Index The S&P 500 has spent much of the last 12 months trailing international benchmarks, something investors don’t see often. But should the U.S. dollar find its footing, the advantage enjoyed by emerging…

U.S. High Yield Credit Spreads vs. VIX

U.S. High Yield Credit Spreads vs. VIX Investors are pricing high-yield credit as if the good times will roll on. Spreads are tight, fundamentals look firm, but that very optimism risks shading into complacency. Active…

Real Price of Gold Per Ounce

Real Price of Gold Per Ounce Gold’s nominal price has climbed past its 1980 peak, but once you factor in inflation, it’s far less frothy than it looks. The market hasn’t lost its head, at…

Seasonality – S&P 500 Cycle Composite for 2026

Seasonality – S&P 500 Cycle Composite for 2026 The S&P 500 Cycle Composite is flagging 2026 as a bullish but choppy year, and for now, the market is playing along with that seasonal script. Image:…

Truck Tonnage vs. S&P 500 Index

Truck Tonnage vs. S&P 500 Index The Truck Tonnage Index rose 0.1% in December. Trucks represent 72.7% of U.S. freight and serve as a barometer of the U.S. economy. This chart shows that, historically, the…

S&P 500 and Equity ETF Flows

S&P 500 and Equity ETF Flows Equity ETFs remain money magnets, pulling in about $5.6 billion a day since the start of the year, up from $3.5 billion in 2025. Flows don’t lie: risk appetite is alive…

Equity Sector Flows

Equity Sector Flows Investors are rotating out of high-growth tech stocks, where outflows have accelerated on overvaluation fears, and back into defensive and “old economy” sectors. Image: J.P. Morgan Equity Derivatives Strategy