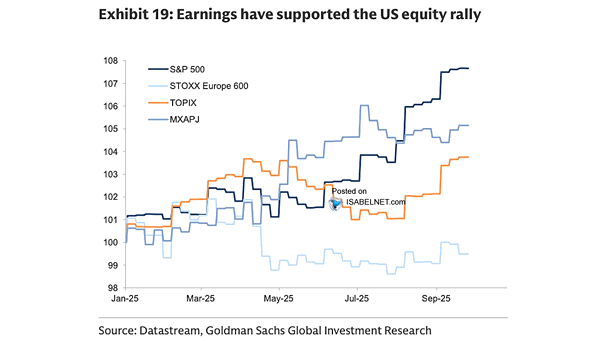
Proportion of S&P 500 Beating Earnings Estimate

Proportion of S&P 500 Beating Earnings Estimate Earnings resilience isn’t fading yet. More S&P 500 companies beating earnings estimates than average is keeping optimism alive and fears of a slowdown at bay—exactly the melody bulls want to hear. Image: Deutsche Bank Asset Allocation

S&P 500 Yearly Performance During Bull Markets

S&P 500 Yearly Performance During Bull Markets History favors the bulls: since 1950, only once has an S&P 500 bull market ended in its fourth year—history therefore favors further upside over a transition to bear market. Image: Carson Investment Research Click the Image to Enlarge

Median 2-Week S&P 500 Returns

Median 2-Week S&P 500 Returns The S&P 500 tends to shine in early October, but history shows its momentum often cools in the back half of the month. Image: Goldman Sachs Global Investment Research

Valuations – Market Values as a Proportion of World GDP

Valuations – Market Values as a Proportion of World GDP Global equities have tripled their weight since the 1990s, jumping from 75% to above 200% of world GDP—an expansion that screams just how far valuations have run. Honestly, what could go wrong? Image: Goldman Sachs Global Investment Research

Corporate Profits After Tax and U.S. Real GDP

Corporate Profits After Tax and U.S. Real GDP In America, corporate profits aren’t just numbers; they’re the oxygen for investment, jobs, and market gains. With such a tight link to the real economy, weaker profits often signal a downshift in momentum. Image: Real Investment Advice

S&P 500 Various Declines per Year

S&P 500 Various Declines per Year Volatility is part of the market’s DNA; the real skill lies in how investors navigate the bumps to keep compounding. Image: Carson Investment Research

U.S. Share Buyback Announcements

U.S. Share Buyback Announcements U.S.companies have ramped up share repurchases this year—buyback authorizations are up 16%—signaling confidence and a continued push to boost shareholder value. Image: Goldman Sachs Global Investment Research

S&P 500 and Combination of Forward PE, VIX, Bullish Sentiment

S&P 500 and Combination of Forward PE, VIX, Bullish Sentiment The Euphoriameter—a mix of forward P/E, VIX, and bullish sentiment—is rising back into levels where past rallies have lost momentum, flashing yellow for cycle-watchers. Image: Topdown Charts

U.S. vs. Non-U.S. Equities Valuations vs. ROE

U.S. vs. Non-U.S. Equities Valuations vs. ROE Investors aren’t shy about paying a premium for U.S. stocks. The payoff? Superior returns on equity and earnings growth that few markets can match. Image: Goldman Sachs Global Investment Research

Share of Global Market Capitalization

Share of Global Market Capitalization With 64% of the world’s equity market, the United States dominates global finance, drawing capital and setting trends that few others can match. Image: Goldman Sachs Global Investment Research

S&P 500 and Margin Debt

S&P 500 and Margin Debt Now above $1 trillion, margin debt stands at just about 1/57th of the total U.S. equity market cap, up 35% from a year ago—still a far cry from the surges seen at past bubble highs. Market tone feels alert, not alarmed. Image: Fidelity Investments