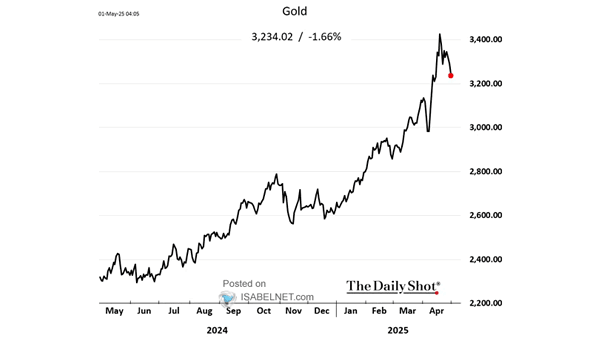
S&P 500 Return Around First Fed Cut After Being on Hold for 6+ Months

S&P 500 Return Around First Fed Cut After Being on Hold for 6+ Months Historically, when the Fed resumes rate cuts after at least six months of holding rates steady, U.S. stocks have often posted strong returns in the subsequent 12 months, particularly if economic growth persists. Image: Goldman Sachs Global Investment Research

10-Year U.S. Treasury Yields with Various Moving Averages

10-Year U.S. Treasury Yields with Various Moving Averages When the Fed prioritizes the labor market over inflation, it can reduce the immediate risk of recession by sustaining employment. However, this is likely to increase inflation expectations and push yields higher. Image: J.P. Morgan

CTAs Exposure to Equities

CTAs Exposure to Equities CTAs’ elevated long equity positions signal a strong bullish stance, but also represent a risk factor for heightened market volatility and rapid equity sell-offs if market trends falter or risk sentiment worsens. Image: Deutsche Bank Asset Allocation

S&P 500 Sector P/E Valuations Relative to History

S&P 500 Sector P/E Valuations Relative to History Historical data and sector-specific valuation metrics show that several S&P 500 sectors have tended to remain overvalued relative to their historical averages and to other sectors. Image: Goldman Sachs Global Investment Research

U.S. Real Yields and Gold

U.S. Real Yields and Gold Gold’s typical inverse link to real rates is fundamental, but inflation expectations, central bank buying, geopolitical risks, and investor sentiment driven by debt and fiscal worries can disrupt this relationship for extended periods. Image: Goldman Sachs Global Investment Research

S&P 500 Performance After 90-90 Days

S&P 500 Performance After 90-90 Days The NYSE “90/90 day” on Friday—when 90% of volume and stocks rose—is rare and bullish. Since 1980, such days often precede strong market gains, with the S&P 500 rising over 90% of the time a year later, averaging 23% gains.

S&P 500 Valuation

S&P 500 Valuation Several long-term valuation metrics indicate that the S&P 500 is significantly overvalued. Historically, elevated valuations like these have typically led to below-average long-term equity returns. Image: Bloomberg

U.S. Equity Index P/E Valuations vs. History

U.S. Equity Index P/E Valuations vs. History A 23x forward P/E ratio for the S&P 500 reflects strong investor optimism, but it also highlights the risk of sharp corrections if earnings or economic conditions weaken. Image: Goldman Sachs Global Investment Research

S&P 500 Target

S&P 500 Target Goldman Sachs maintains its forecast that the S&P 500 will reach 6,600 by year-end and 6,900 within 12 months, supported by expectations of earlier Fed rate cuts and strong fundamentals. Image: Goldman Sachs Global Investment Research