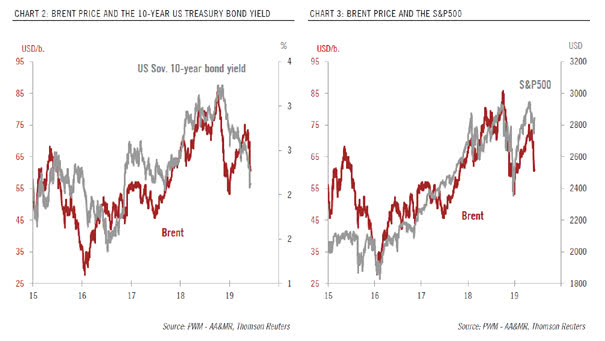
91.2% Correlation Between Gold Price and U.S. National Debt

91.2% Correlation Between Gold Price and U.S. National Debt According to the National Inflation Association, there’s 91.2% correlation between gold price and U.S. national debt. The U.S. government’s public debt is now more than $22 trillion. Over the long term, the price of gold could continue to rise as debt increases. Image: U.S. Global Investors

Gold Has Crushed the S&P 500 So Far Since 2000

Gold Has Crushed the S&P 500 So Far Since 2000 Gold has returned a great 345.30 percent, while the S&P 500 has returned 146.57 percent since 2000. Keep in mind that Gold has beaten the US stock market over multiple time periods Historically, Gold has also had a strong negative correlation with the US stock…

Lumber Prices Are a Great Leading Indicator of Future Earnings

Lumber Prices Are a Great Leading Indicator of Future Earnings This chart suggests that lumber prices give a good forecast of where the stock market is going. When lumber prices fall over a 12-month period, then EPS follows 6 months later. Although there is no immediate recession on the horizon, a market downturn is possible. Image:…

US Long-Term Mortgage Rates Decline: 30-Year Average 4.10% & 15-Year Average 3.57%

US Long-Term Mortgage Rates Decline: 30-Year Average 4.10% & 15-Year Average 3.57% Why US long-term mortgage rates decline? Mortgage costs are influenced by the 10-year Treasury yield which was lower this week, because the trade war between the United States and China pushes investors moving money from stocks to bonds. Bond yields fall as prices rise.…

Unicorn IPOs, Are They Good Investments?

Unicorn IPOs, Are They Good Investments? Keep in mind that most IPOs lose money for investors after 5 years. Images: CNBC, Hedgeye Risk Management LLC

“U.S. Stock Market, No Froth In Sight” Says Stock Market Sentiment Index

“U.S. Stock Market, No Froth In Sight” Says Stock Market Sentiment Index Keep in mind that it is just another investor sentiment tool. But it does not show at all if the US stock market is overvalued or undervalued. See our stock market valuation model (99% correlation and R² = 0.97 since 1970).

Can History Help Us Predict the Future of the S&P 500?

Can History Help Us Predict the Future of the S&P 500? When the S&P 500 hits all-time high and AAII Investor Sentiment Survey bulls is below 35%, then 88% of the time the S&P 500 is positive one year later (1986-2019). Image: SentimenTrader